
Introduction
If you own more than one PG, you have probably asked which one is actually doing better. The answer is rarely obvious. One building may bring in more rent, while the other quietly earns more per bed. To compare PG property performance fairly, you need the same metrics, the same time period, and clean records for both.
This guide shows you which numbers matter, how to calculate them, and how to avoid common comparison mistakes. It also covers how to read the results and act on them. Good PG and hostel management software can make this far easier, but the method works even if you are still using registers or spreadsheets.
What Does It Mean to Compare PG Property Performance?
To compare PG property performance, measure both properties on the same core metrics over the same period, then adjust for size and context. The main metrics are occupancy rate, rent collection efficiency, revenue per bed, expense ratio, net profit per bed, tenant turnover, and complaint resolution.
Raw totals can mislead you. A 60-bed PG will almost always earn more than a 20-bed PG. That does not mean it is managed better. Fair comparison means asking how each property performs per bed, per rupee billed, and per month.
Step 1: Set Up a Fair Comparison
Before you calculate anything, make sure you are comparing like with like.
Use the same time period.
Compare the same month, quarter, or financial year for both properties. PGs near colleges and IT parks have seasonal swings. A month with a batch of new admissions can make one property look better than it is.
Use the same definitions.
Decide once what each term means and apply it to both properties. For example:
- Is a bed “occupied” from the joining date or from the first rent payment?
- Are deposits counted as income? (They usually should not be, since they are refundable.)
- Are owner-paid utilities and staff salaries counted as expenses in both properties?
Note the context.
Write down the differences that affect results but are not management quality:
- Location and neighbourhood demand
- Age and condition of the building
- Sharing types (single, double, triple)
- Food included or not
- Target tenants (students, working professionals, women-only)
Step 2: Track the Core Metrics
These are the numbers that show how each property is really doing.
1. Occupancy rate
Occupancy rate is the percentage of your beds that are filled.
Occupancy rate = (Occupied beds ÷ Total beds) × 100
If 34 of 40 beds are filled, occupancy is 85%. Track this at the end of each month and also as an average across the month. A property that hits 95% on the last day but sat at 70% for three weeks is not performing well.
2. Rent collection efficiency
Collection efficiency shows how much of the rent you billed was actually collected.
Collection efficiency = (Rent collected ÷ Rent billed) × 100
Two PGs can have identical occupancy but very different cash flow. A property with 92% occupancy and 80% collection is often worse off than one with 85% occupancy and 97% collection. Also track how many tenants pay late and by how many days.
3. Revenue per bed
Revenue per bed = Total rent collected ÷ Total beds
Divide by total beds, not occupied beds. This captures both pricing and vacancy in one figure, which makes two different-sized properties easy to compare.
4. Expense ratio and expense per bed
Expense ratio = (Total expenses ÷ Total rent collected) × 100
Group expenses by category so you can see where the gap comes from:
- Electricity and water
- Staff and salaries
- Food and kitchen (if applicable)
- Repairs and maintenance
- Internet
- Housekeeping and consumables
A property with a high expense ratio is not always badly run. An older building may simply cost more to maintain. But the category breakdown tells you where to look.
5. Net profit per bed
Net profit per bed = (Rent collected − Total expenses) ÷ Total beds
This is usually the single most useful number for comparing two properties. It combines pricing, occupancy, collections, and cost control.
6. Tenant turnover and average stay
Turnover tells you how stable your tenant base is.
Monthly turnover = (Tenants who vacated ÷ Total occupied beds) × 100
Also note the average length of stay and how many days a bed stays empty between tenants. High turnover means more vacancy days, more admin work, and more marketing effort.
7. Complaint volume and resolution time
Complaints reflect the tenant experience. Track:
- Number of complaints per month
- Most common complaint types (water, Wi-Fi, cleanliness, food)
- Average time to resolve
- Repeat complaints for the same issue
A property with few complaints and fast resolution usually retains tenants longer.
Step 3: See It in a Worked Example
Here is an illustrative example. The numbers are made up to show the method.
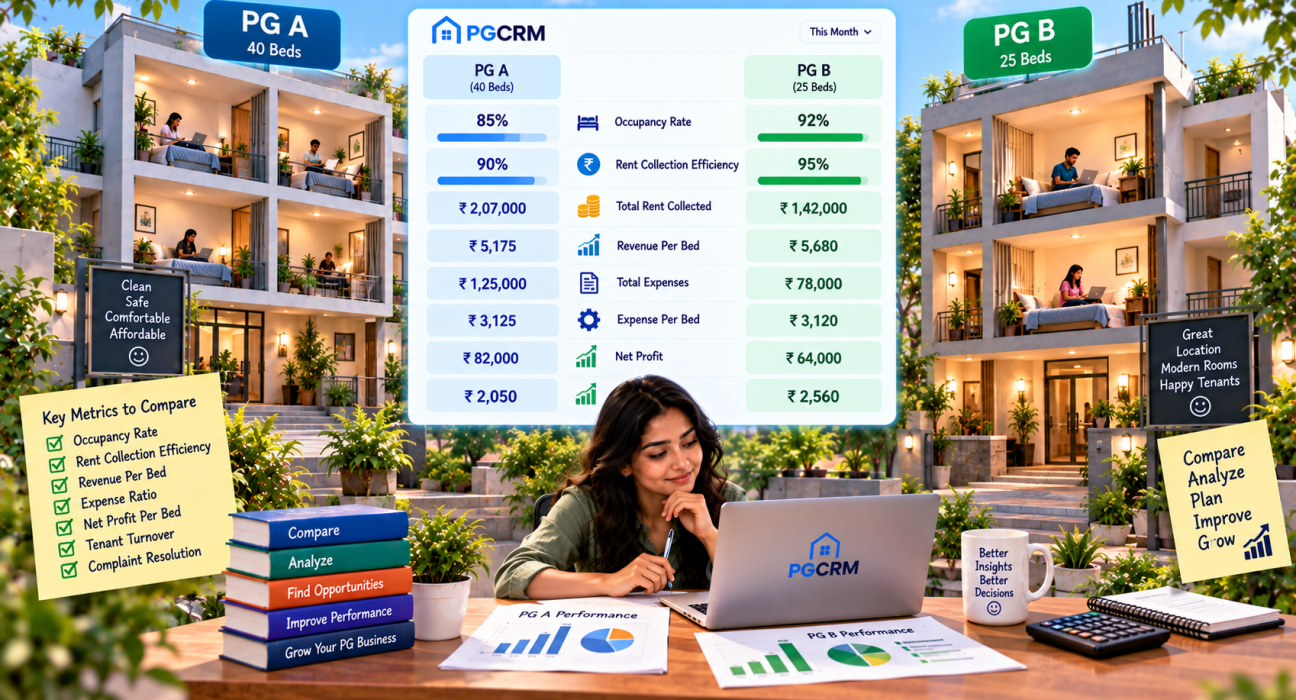
| Metric | Property A (40 beds) | Property B (25 beds) |
|---|---|---|
| Occupied beds | 34 | 23 |
| Occupancy rate | 85% | 92% |
| Rent billed | ₹2,30,000 | ₹1,49,500 |
| Rent collected | ₹2,07,000 | ₹1,42,000 |
| Collection efficiency | 90% | 95% |
| Total expenses | ₹1,25,000 | ₹78,000 |
| Expense per bed | ₹3,125 | ₹3,120 |
| Net profit | ₹82,000 | ₹64,000 |
| Net profit per bed | ₹2,050 | ₹2,560 |
| Complaints (avg. resolution) | 14 (3 days) | 6 (1.5 days) |
At first glance, Property A looks stronger because it earns ₹82,000 against ₹64,000. But per bed, Property B earns about 25% more. It also has better occupancy, better collections, and faster complaint resolution.
The takeaway: Property A has room to grow. If it matched Property B’s occupancy and collection habits, its profit would rise noticeably. Property B’s lever is different, since it has fewer beds, so growth may mean adding capacity or raising rents carefully.
Step 4: Dig Into the Reasons Behind the Numbers
Numbers tell you what is different. The next step is finding out why.
If occupancy is lower
- Check how long beds stay empty after a tenant vacates.
- Review pricing against nearby PGs.
- Look at which room types are hardest to fill.
- Check whether complaints or maintenance issues are pushing tenants out.
If collection efficiency is lower
- Identify tenants who are repeatedly late.
- Check whether reminders go out before the due date.
- Look at whether payment options (cash, UPI) are convenient.
- Review whether the manager follows up consistently.
If expenses are higher
- Compare each expense category side by side.
- Look for one-time repairs that distort a single month.
- Check for wastage in electricity, water, or food.
If turnover is higher
- Ask departing tenants why they are leaving.
- Compare complaint history for those tenants.
- Check whether notice periods and deposit rules are applied the same way in both properties.
Common Mistakes When Comparing PG Properties
Comparing total income instead of per-bed income. Bigger properties always look better on totals.
Using one month only. Look at three to six months to smooth out seasonal effects.
Ignoring pending rent. Billed rent is not the same as collected rent.
Mixing deposits with income. Refundable deposits inflate revenue and hide the true picture.
Blaming the manager for structural differences. A property in a weaker location or an older building may need different targets.
Relying on memory or scattered records. If data lives in notebooks, WhatsApp chats, and separate spreadsheets, the comparison will be slow and error-prone.
How to Compare Two PG Properties With Software
The hardest part of comparing properties is not the maths. It is collecting reliable, consistent data from both buildings every month.
Using PG management software such as PGCRM can help owners keep building, room, and bed information, tenant records, rent status, expenses, and complaints in one place. According to the PGCRM website, the platform provides occupancy reports, income and expense reports, expense tracking by category and building, and a single view across multiple buildings. That makes it easier to pull the same figures for each property without rebuilding them by hand.
Here is a simple monthly routine:
- Close the month. Make sure all rent payments (cash and UPI) and expenses are recorded for both properties.
- Pull the same reports. Take occupancy, income, and expense reports for each property.
- Calculate the core metrics. Work out occupancy, collection efficiency, revenue per bed, and net profit per bed.
- Compare side by side. Put the numbers in one table like the example above.
- Investigate the biggest gap. Pick one or two differences and find the cause.
- Set one action per property. For example, “cut vacancy days” for A and “review rent levels” for B.
- Review next month. Check whether the action moved the number.
Manual Tracking vs Software: A Quick Comparison
| Area | Registers/spreadsheets | PG management software |
|---|---|---|
| Data consistency across properties | Depends on each manager | Same structure for every building |
| Pending rent visibility | Needs manual checking | Live pending list |
| Expense breakdown | Often incomplete | Recorded by category and building |
| Month-end reporting | Hours of manual work | Reports generated from recorded data |
| Comparing two properties | Slow and error-prone | Faster and more reliable |
Software does not fix a poorly run property. It gives you accurate data so you can see the problem sooner.
Frequently Asked Questions
What is the best metric to compare two PG properties?
Net profit per bed is usually the most useful single metric. It accounts for occupancy, pricing, collections, and expenses, and it adjusts for the number of beds. Still, look at occupancy and collection efficiency alongside it, because they show where any gap comes from.
How often should I compare my PG properties?
Review them monthly, and do a deeper comparison every quarter. Monthly reviews help you catch problems early, such as rising vacancy or late rent. Quarterly reviews smooth out seasonal swings and show real trends in profit, turnover, and expenses.
How do I compare a large PG with a small one?
Convert everything to per-bed or percentage figures. Use occupancy rate, revenue per bed, expense per bed, and net profit per bed instead of totals. This removes the size advantage and shows which property uses each bed more effectively.
What is a good occupancy rate for a PG?
There is no single number that applies everywhere. It depends on location, season, and tenant type. A better approach is to compare your own properties over time and against similar PGs in your area, then work to reduce empty bed days.
How can I find out why one PG earns less than another?
Break the gap into parts. Check occupancy, then pricing, then collection efficiency, then expenses. Usually one or two of these explain most of the difference. Comparing expense categories and complaint history side by side often reveals the cause quickly.
Can PG management software help compare multiple properties?
Yes. Software that stores rooms, tenants, rent, expenses, and complaints for every building in one place makes it easier to pull consistent reports. PGCRM, for example, offers a single view across multiple buildings, along with occupancy and income and expense reports.
Should I include deposits when I calculate revenue?
No. Security deposits are usually refundable, so counting them as income overstates performance. Track deposits separately and include only rent and other earned charges, such as fines, in revenue. Apply the same rule to both properties so the comparison stays fair.
Conclusion
The best way to compare PG property performance is to use the same metrics, the same period, and per-bed figures for both properties. Start with occupancy, collection efficiency, revenue per bed, expense ratio, and net profit per bed. Then use tenant turnover and complaint data to understand the reasons behind the gaps.
Accurate comparison depends on accurate records. If you want all your buildings, tenants, rent, and expenses in one place, explore PGCRM to simplify your PG and hostel management.